3D map of Bárðarbunga seismic activity
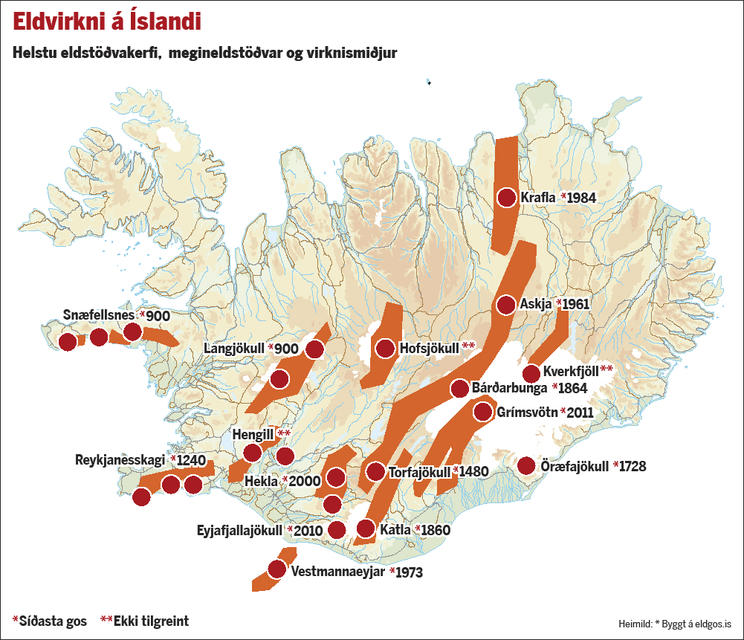
A map showing volcanic activity in the past.
Kort/Elín Esther
Topic
Bárðarbunga
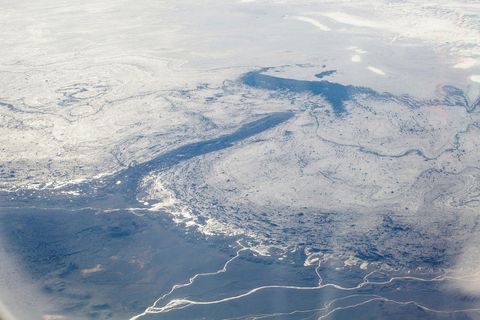
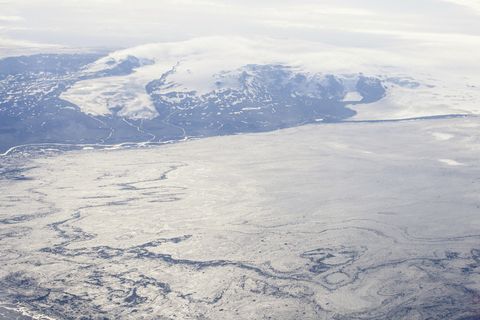
The Icelandic Met Office has created a 3D video of the seismic activity in Bárðarbunga. The mapshows activity during the period of August 16th to 20th.
The color of the dots indicates when the earthquake occured. Red dots are oldest, then orange, yellow, light-green and finally green dots represent the most recent earthquakes.
Topic
Bárðarbunga

 Kaldasti veturinn kom að óvörum
 „Höfum ekki náð að skríða upp úr þeirri gryfju“
 Breytingar á skipulagi fréttadeildar RÚV
 Nemendur í HÍ reistu tjaldbúðir án leyfis
/frimg/1/48/74/1487454.jpg) Heldur inn í nóttina tuttugu kílóum léttari
Heldur inn í nóttina tuttugu kílóum léttari
 Gígbarmurinn hækkað frá því í gær
 Telur forsendur fyrir vaxtalækkun